Credit Risk 360
How a $12.8B commercial lending book cut modeled default exposure 31% in one year.
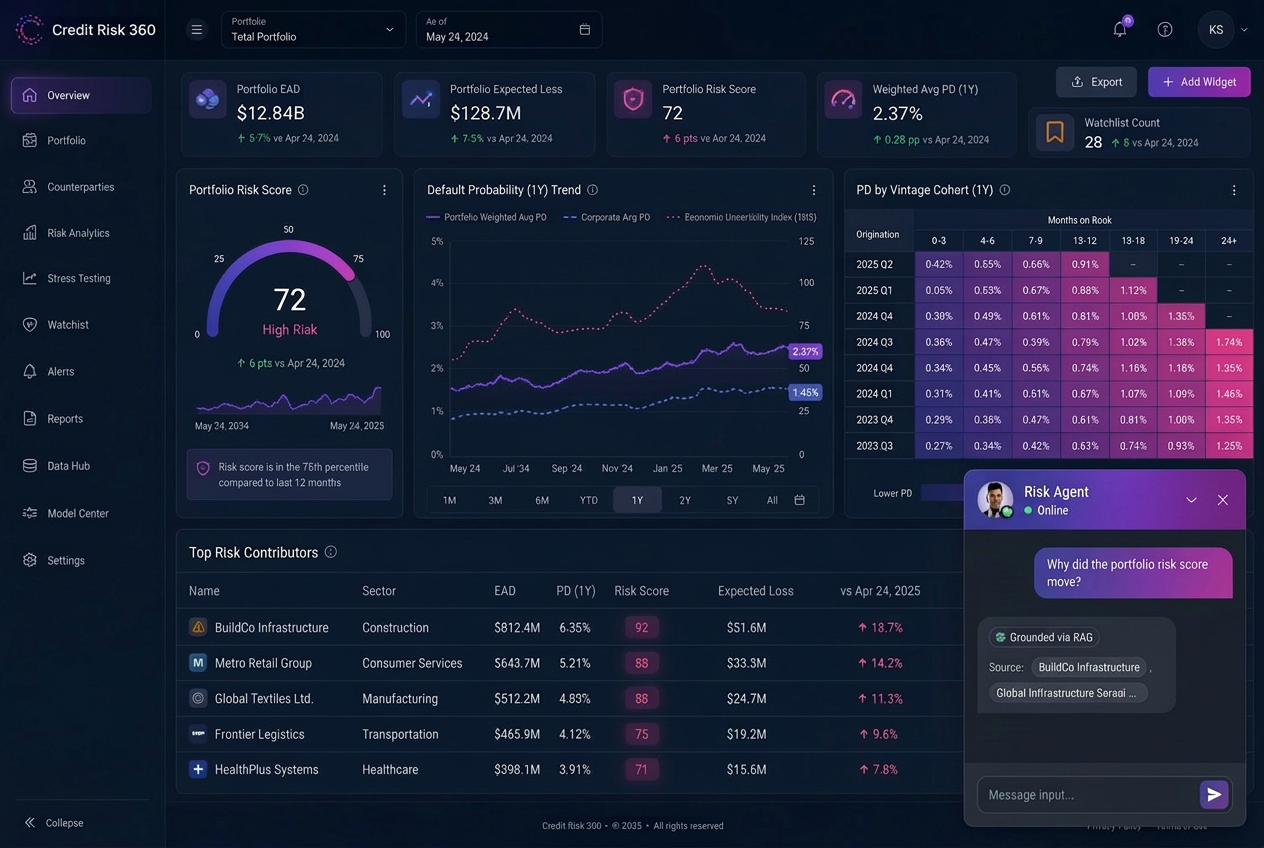
An enterprise credit-risk platform that gives lending teams real-time portfolio sensing — with a GenAI layer that turns live risk data into plain-language narratives and explainable, auditable recommendations.
Explore the live dashboard
A working slice of the product. Switch the time range to watch the trend, sector cohorts, and the AI agent assistant respond in real time.
Credit Risk 360 · Live Demo
Total Portfolio · as of May 2025
Default Probability Trend
1Y · weighted PDPD by Sector Cohort
1Y PD %From challenge to outcome
The Problem
What We Learned
The Strategy
How It Was Built
Accessibility
The Impact
What I Carry Forward
Structure, flow & fidelity
How the product was organised, the path a user actually takes through it, and how the work travelled from scratch wireframes to a working prototype.
Information architecture
Portfolio overview
- Risk KPIs
- PD trend
- Sector cohorts
- AI agent assistant
Alerts
- Early-warning queue
- Severity & band
- Assignment
- Snooze / escalate
Cohort & account
- Cohort drill-down
- Vintage migration
- Account timeline
- Exposure detail
Decisions
- Recommended action
- Accept / dismiss / annotate
- Decision log
- Audit export
User flow of the core task
- Step 01
Scan portfolio
Officer opens the portfolio view and reads risk direction, not a static score.
- Step 02
Open an alert
A flagged cohort opens with the figures that triggered it already in context.
- Step 03
Drill to cohort
Vintage migration and PD distribution explain who is moving and why.
- Step 04
Ask the agent
The grounded AI agent proposes a ranked action, each claim linked to a figure.
- Step 05
Log the decision
Accept, dismiss or annotate — written to an auditable decision log.
Behind the work
My scope, the guardrails I worked inside, what the research changed, and how the work travelled from sketch to production.
My role & scope
Design lead, end-to-end: discovery workshops with credit officers, information architecture, the alert-to-decision flow, the risk-narrative interface, and the semantic risk tokens shipped into the platform design system. Worked with 4 engineers, a risk PM, and a model-risk reviewer over 9 months.
Constraints & guardrails
- Model-risk governance: every AI statement had to be traceable to a visible figure before it could ship.
- Legacy batch pipeline — portfolio state refreshed overnight, so the UI had to communicate data age honestly.
- Bank design standards and WCAG AA contrast on dense, colour-coded risk data.
- No net-new training for 300+ officers; the interface had to be learnable in one sitting.
What research changed
- Shadowing 14 credit officers showed they reason in cohorts and trajectories, never single-account scores.
- Analytics showed 62% of alert clicks ended with no logged action — the alert carried no context to act on.
- Usability testing on the first build: 5 of 8 officers could not explain where a score came from.
The pivot
The first direction was a scored watchlist ranked by PD. It tested badly — officers distrusted a number they could not decompose. We rebuilt around trajectory: alert opens a cohort, cohort opens an account timeline, and every AI claim links back to the figure behind it.
UX metric → business impact
Whiteboard alert-to-decision maps and paper cohort flows tested with officers before any UI existed.
Clickable prototype of the cohort drill-down plus annotated states for empty, stale and low-confidence AI output.
Live dashboard with semantic risk tokens, gradient trend charts, sector heatmaps, and the grounded narrative panel.
Retrospective
Instrument the decision log from day one instead of month four — we lost early baseline data that would have made the exposure claim tighter.
In regulated enterprise work, explainability is the adoption strategy. Officers accept AI guidance only when they can decompose it, and stakeholder alignment gets easier the moment every claim points at a number.
“We stopped finding out about deterioration at month-end. The narrative tells us which cohorts are moving and why, and we can defend every call to the regulator.”