Merchant Onboarding
How an acquiring platform cut time-to-live 38% and auto-verified 84% of onboarding documents.
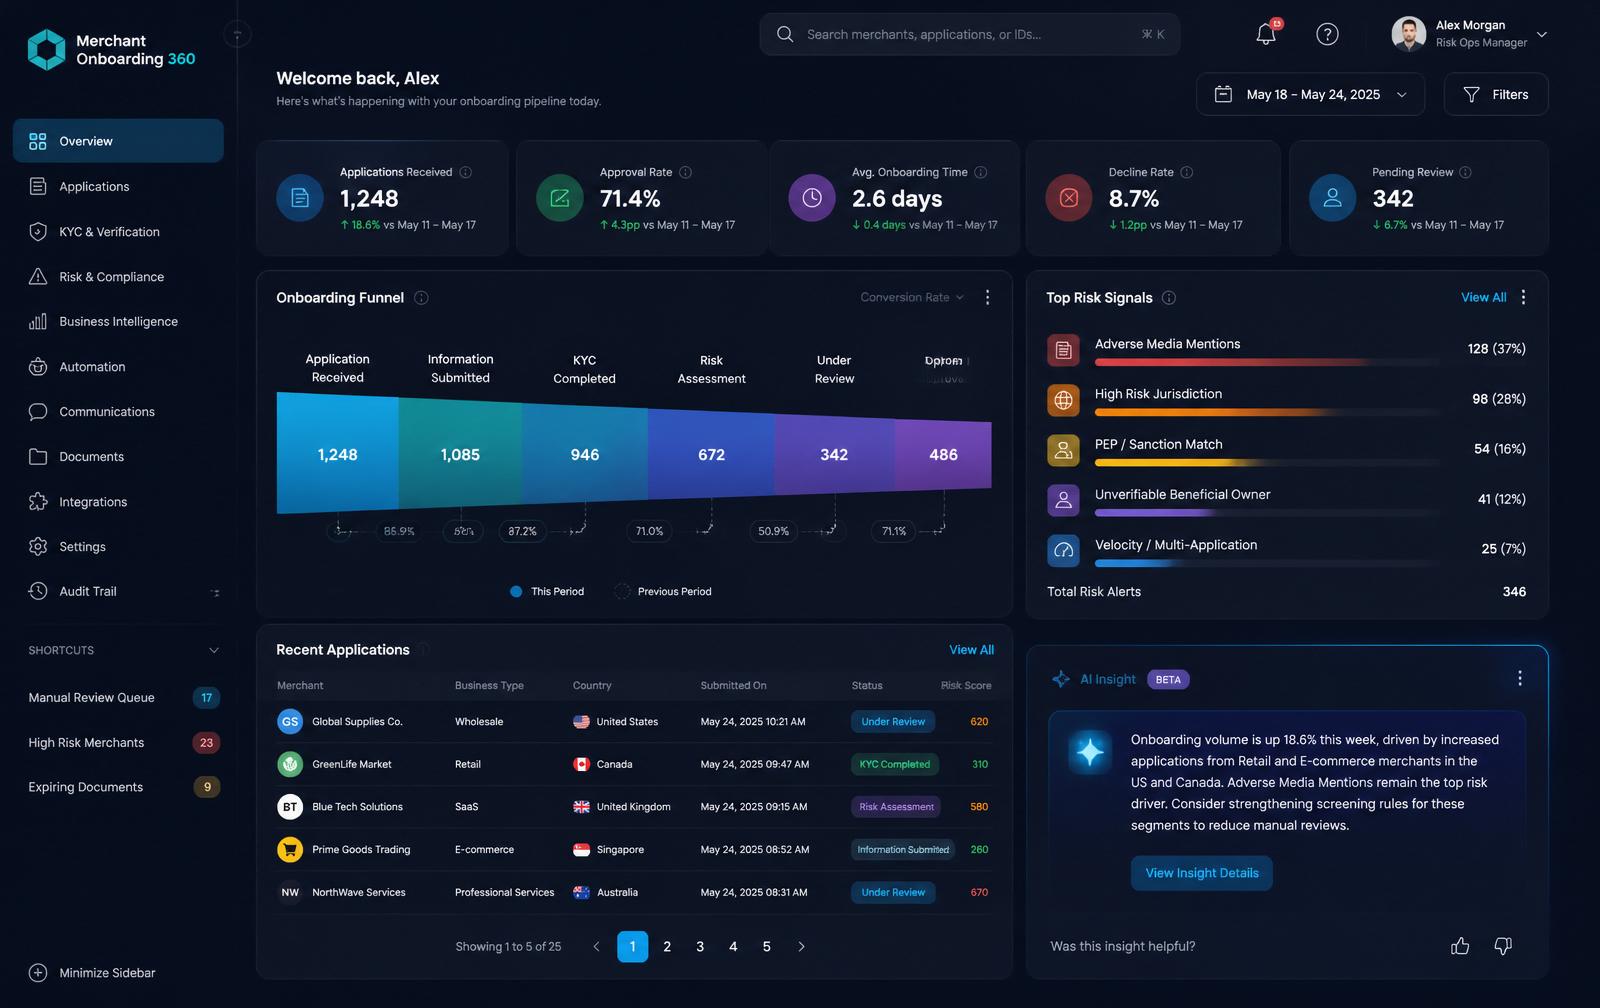
An enterprise web application that gives merchant-services teams a single-screen command center for the full onboarding pipeline — funnel analytics, KYC/KYB automation, live risk signals, and a GenAI layer that gets legitimate merchants live faster.
What the web application does
Six core capabilities turn a fragmented, multi-tool process into one browser-based workspace — built for the dense, decision-heavy work of merchant onboarding.
Unified web workspace
A responsive desktop app-shell — persistent sidebar, global search, and time-range controls — replaces a patchwork of disconnected tools with one browser-based command center.
Live funnel analytics
Every onboarding stage from application to approval is charted with conversion and drop-off, so teams see exactly where merchants stall — in real time, at any range.
KYC / KYB automation
Identity and business verification run automatically as documents arrive, extracting fields, flagging mismatches, and clearing low-risk merchants without manual review.
Risk & compliance layer
Adverse-media, sanctions/PEP, jurisdiction, and velocity signals surface as ranked, color-coded alerts with explainable, audit-ready reasoning.
GenAI copilot
A grounded LLM reads the live funnel and risk signals to write a plain-language narrative plus a ranked set of next actions — every claim linked back to the data.
Case & queue management
Stalled applications route into review queues with full context, so analysts act on the right file at the right moment without re-deriving what the system already knows.
Explore the live web application
A working slice of the product, rendered as the real desktop app-shell. Switch the time range to watch the onboarding funnel, KPIs, live risk signals, and the AI agent assistant respond in real time. Hover any metric for a plain-language definition.
Welcome back, Alex
Here's what's happening across your onboarding pipeline · as of May 2025
Onboarding Funnel
7D · merchants per stageTop Risk Signals
from screening engine- High
Adverse media mentions
128 flagged for review
- Medium
High-risk jurisdiction
98 applications
- Medium
PEP / sanctions match
54 potential matches
- Low
Unverifiable beneficial owner
41 cases
- Low
Velocity / multi-application
25 anomalies
Recent applications
| Merchant | Business type | Country | Status | Risk score |
|---|---|---|---|---|
| Global Supplies Co. | Wholesale | United States | Under Review | 620 |
| GreenLife Market | Retail | Canada | KYC Completed | 310 |
| Blue Tech Solutions | SaaS | United Kingdom | Risk Assessment | 580 |
| Prime Goods Trading | E-commerce | Singapore | Info Submitted | 260 |
| NorthWave Services | Professional | Australia | Under Review | 670 |
Metrics glossary
plain-language definitions for every metric on this dashboard- Applications Received
- Total merchant applications that entered the onboarding pipeline in the selected period.
- Approval Rate
- Share of applications that clear every stage and are approved to transact.
- Avg. Onboarding Time
- Mean time from application received to approval decision.
- Fraud Blocked
- Applications stopped by KYC, AML, or risk checks before approval.
- KYC / KYB
- Know Your Customer / Know Your Business — verifying the identity and legitimacy of a merchant and its owners.
- PEP / Sanctions
- Politically Exposed Person and global sanctions screening to prevent onboarding prohibited entities.
- Beneficial Owner
- The individual who ultimately owns or controls a business; must be identified for compliance.
- Risk Score
- A 0–1000 composite of fraud, credit, and compliance signals; higher means more risk.
- pp (percentage points)
- The absolute difference between two percentages. +4pp means a rate rose from, e.g., 70% to 74%.
From challenge to outcome
The Problem
What We Learned
The Strategy
How It Was Built
Accessibility
The Impact
What I Carry Forward
Structure, flow & fidelity
How the product was organised, the path a user actually takes through it, and how the work travelled from scratch wireframes to a working prototype.
Information architecture
Pipeline
- Application queue
- Stage & ageing
- Owner assignment
- SLA breaches
Case view
- Merchant profile
- Risk & KYC checks
- Document set
- Activity history
Operations
- Bulk actions
- Escalations
- Notes & handoffs
- Exceptions
Reporting
- Throughput
- Drop-off analysis
- Team performance
- Exports
User flow of the core task
- Step 01
Open the pipeline
Ops lead sees where every application is stuck and for how long.
- Step 02
Pick a case
The case opens with checks, documents and history in one console.
- Step 03
Resolve the block
Request info, override a check or escalate — without leaving the case.
- Step 04
Hand off cleanly
Notes and activity travel with the case to the next reviewer.
- Step 05
Review throughput
Reporting closes the loop on SLA and drop-off.
Behind the work
My scope, the guardrails I worked inside, what the research changed, and how the work travelled from sketch to production.
My role & scope
Lead designer for the 360° merchant view: research with operations and support teams, the unified merchant profile IA, cross-team component library additions, and the analytics surface. Two designers reported to me on this stream.
Constraints & guardrails
- Data stitched from four systems with different refresh rates — freshness had to be visible per panel.
- Existing brand and component library; no new patterns without design-system review.
- Support agents work under handle-time targets, so any added step needed to pay for itself.
- PII exposure rules limited what could be shown on a shared screen.
What research changed
- Call shadowing: agents opened an average of 5 tabs to answer one merchant question.
- Ticket analysis showed a third of escalations were caused by missing transaction context, not policy.
- Testing revealed agents scan for anomalies first, so the profile had to lead with exceptions, not attributes.
The pivot
The first layout was a tabbed profile organised by source system. Agents kept getting lost, so we reorganised around the questions they actually ask — who is this merchant, is anything wrong, what changed — and demoted system boundaries entirely.
UX metric → business impact
Card-sorting output and question-led wireframes drawn from call shadowing notes.
Prototype with loading, stale-data and restricted-PII states, reviewed with the design-system group.
Shipped 360° profile with live activity, risk posture and portfolio analytics panels.
Retrospective
Bring the data owners into the earliest workshops — several freshness constraints only surfaced after the IA was set, forcing rework.
Organise enterprise screens around the user's question, not the source system. Alignment across teams gets far easier once everyone reads the same profile.
“Moving it out of the phone concept and into a real analyst workspace was the call that made the numbers move. One screen, the whole pipeline.”